Supported Browsers
Windows: Google Chrome, FireFox
Mac: Google Chrome, FireFox, Safari
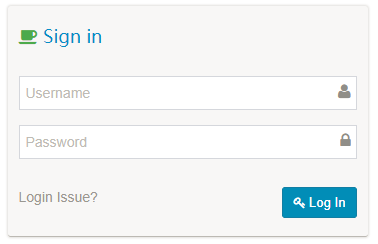
1. Access & Login
Host to access: http://hostname:7070
Login with username: ADMIN
Login with password:KYLIN
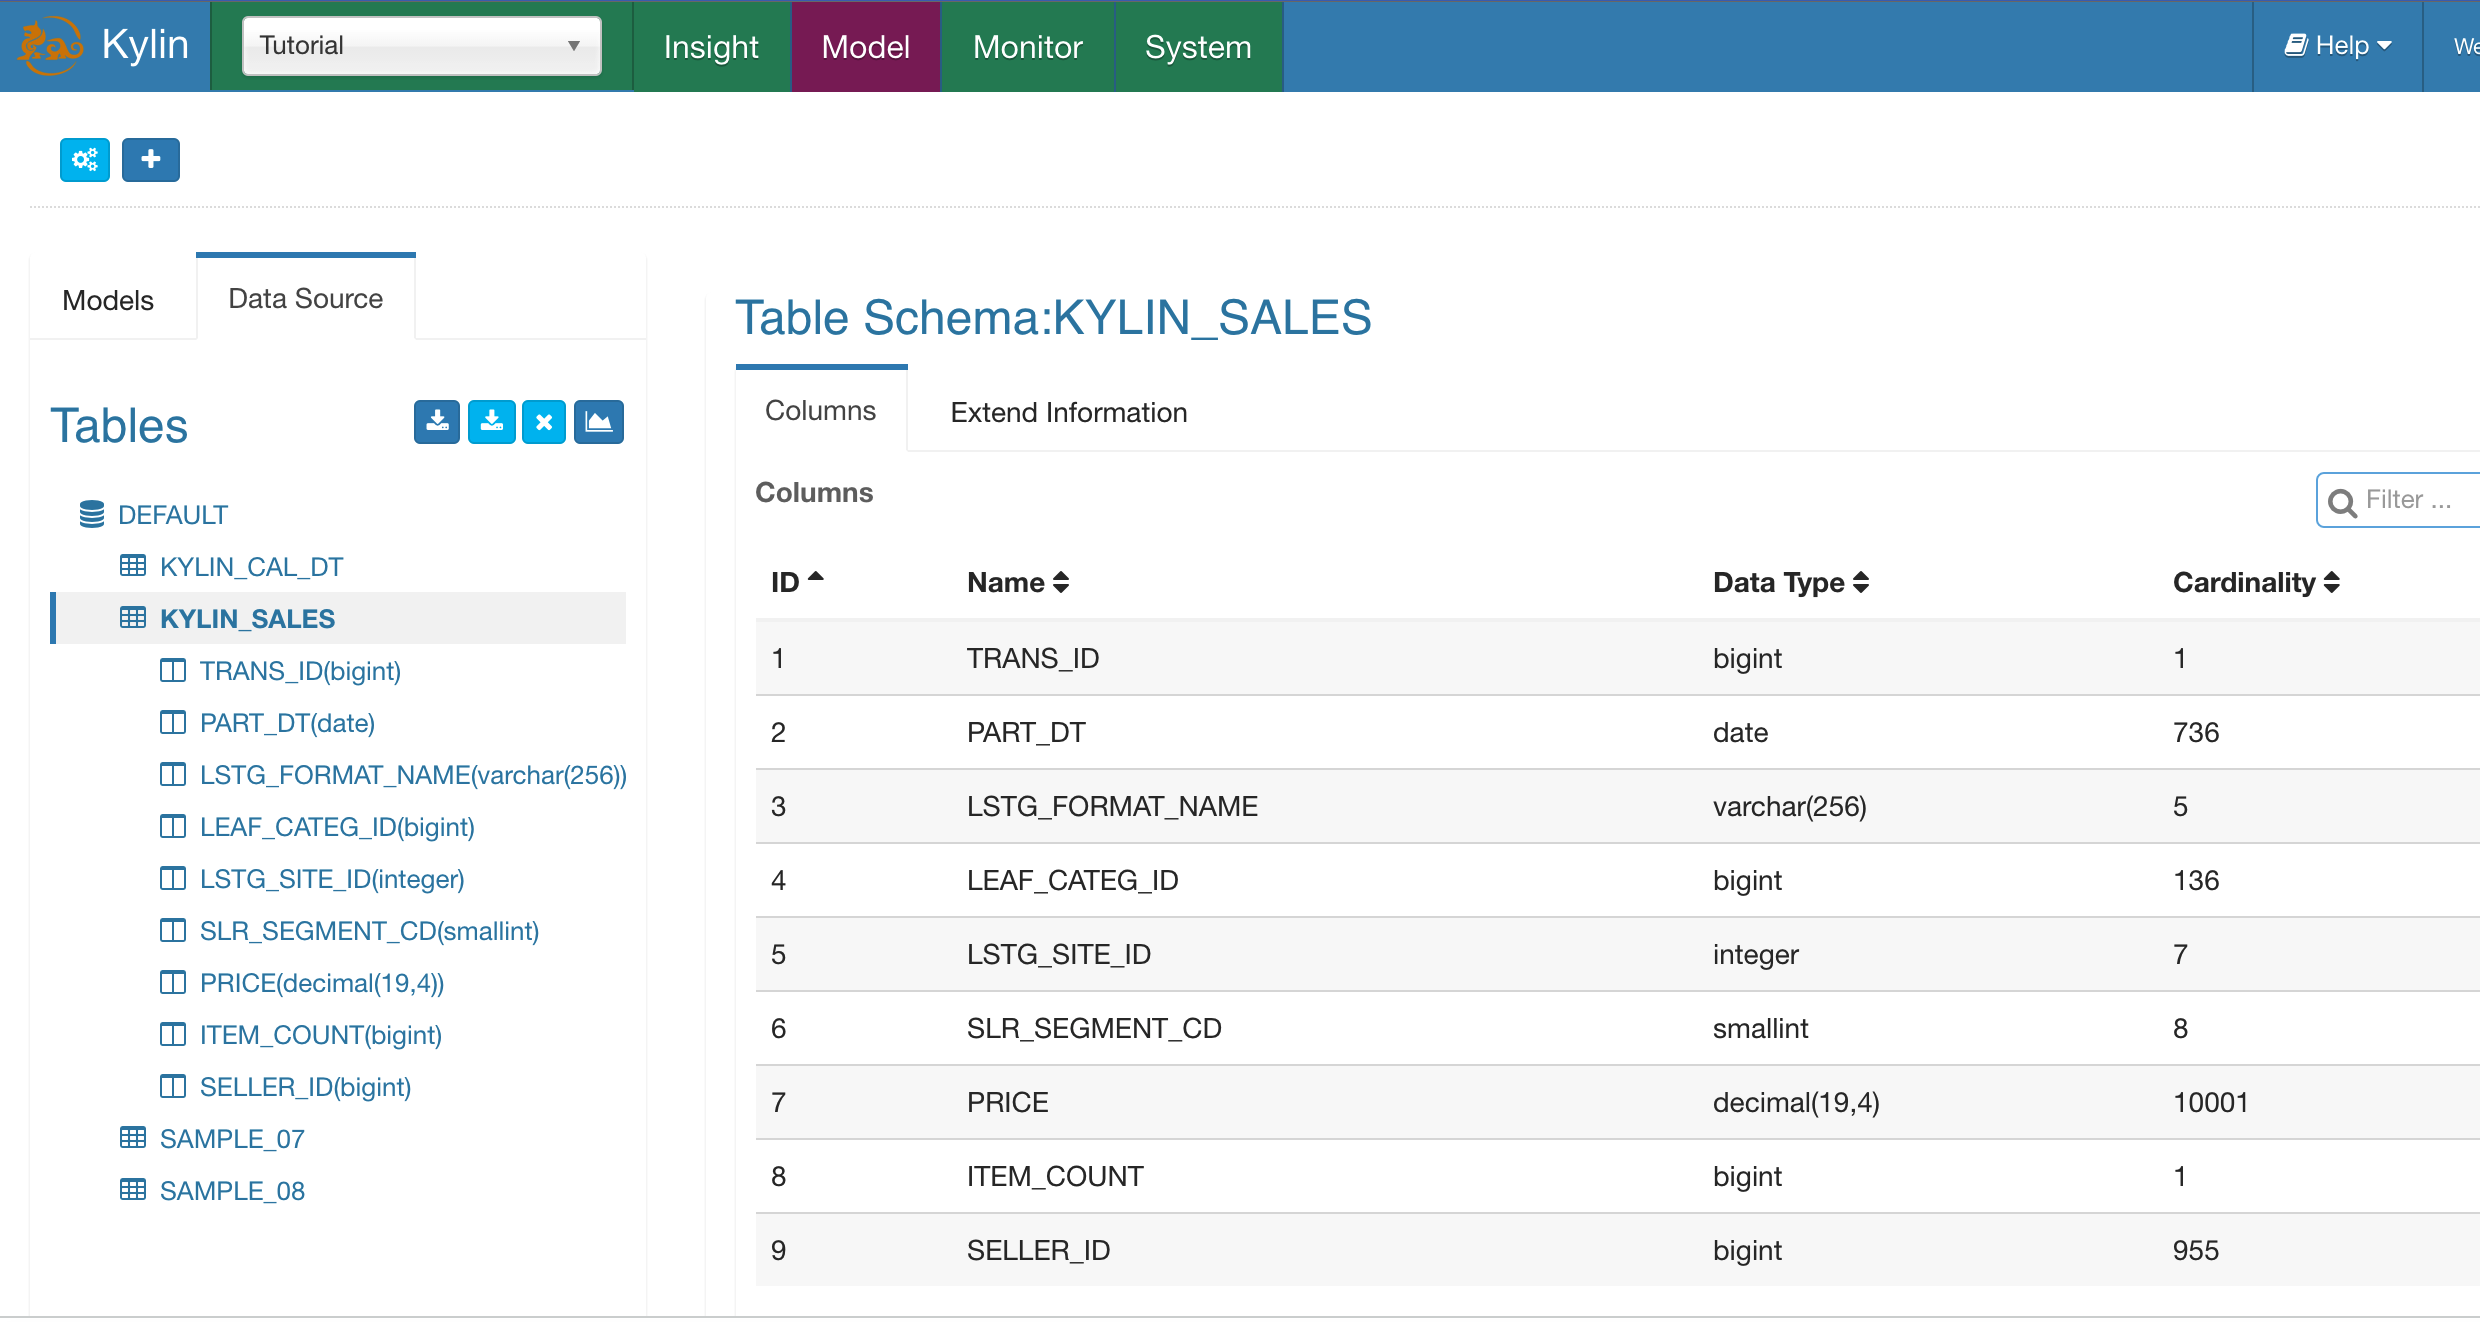
2. Sync Hive Table into Kylin
Although Kylin will using SQL as query interface and leverage Hive metadata, kylin will not enable user to query all hive tables since it’s a pre-build OLAP (MOLAP) system so far. To enable Table in Kylin, use “Sync” function to sync up hive table metadata to Kylin.
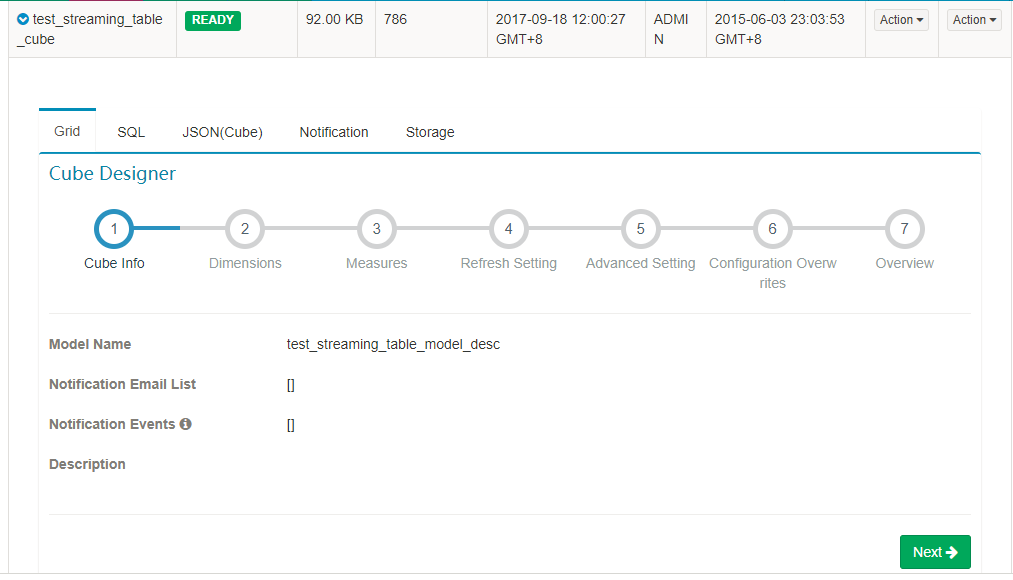
3. Kylin OLAP Cube
Kylin’s OLAP Cubes are pre-calculation datasets from star/snowflake schema tables, Here’s the web interface for user to explore, manage all cubes. Go to Model menu, it will list all cubes available in system.
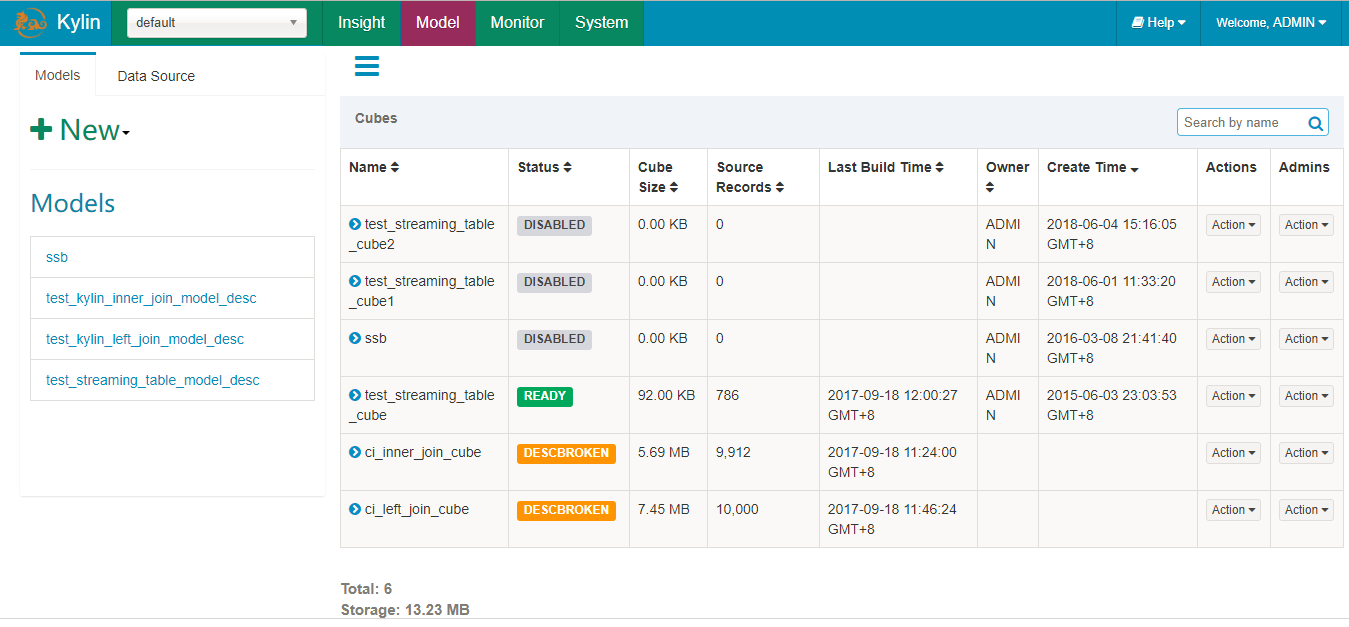
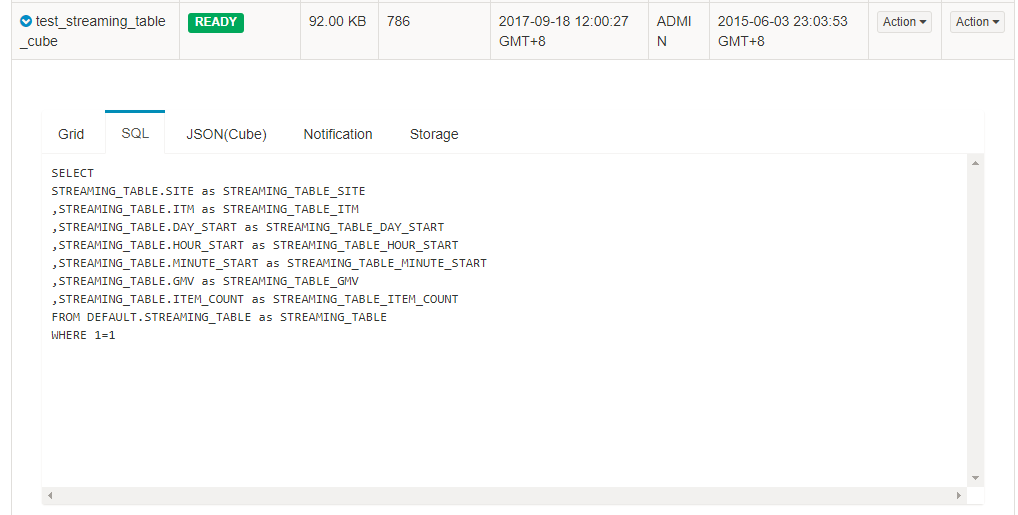
To explore more detail about the Cube.
-
Grid View:
-
SQL View (Hive Query to read data to generate the cube):
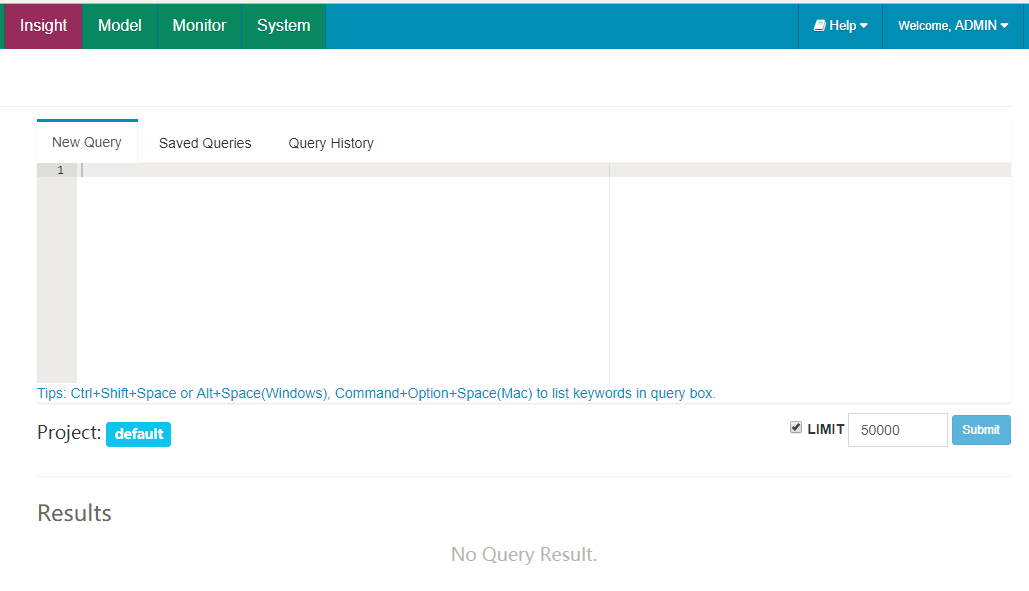
4. Write and Execute SQL on web
Kylin’s web offer a simple query tool for user to run SQL to explore existing cube, verify result and explore the result set using Pivot analysis and visualization next chapter.
Query Limit
Only SELECT query be supported
Aggregation function and GROUP BY are supported
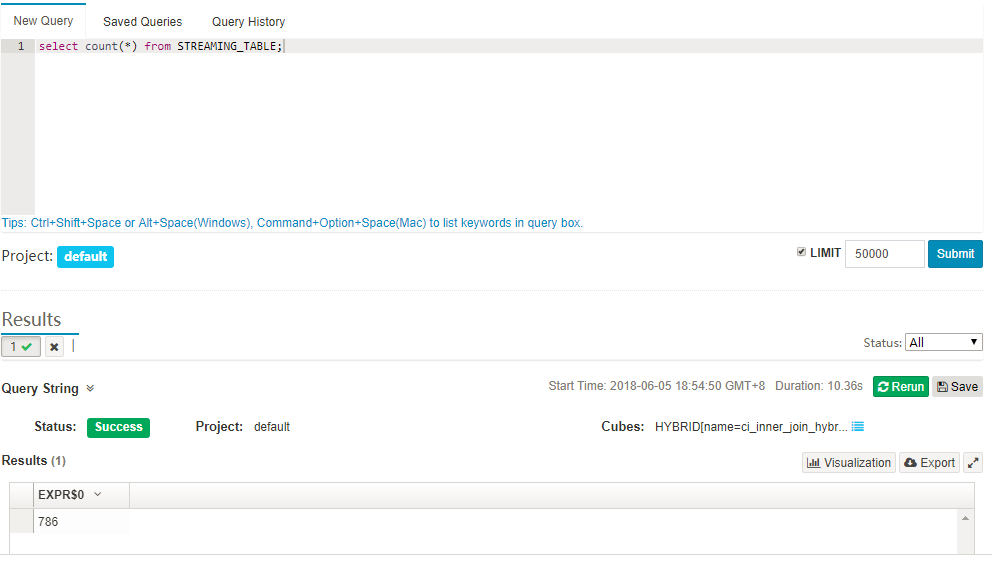
Go to “Insight” menu.
-
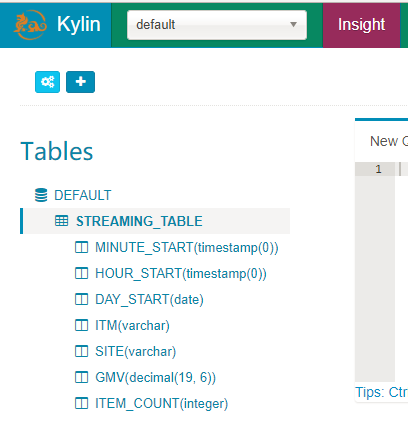
Source Tables:
Browser current available tables (same structure and metadata as Hive).
-
New Query:
You can write and execute your query and explore the result.
-
Saved Query:
Associate with user account, you can get saved query from different browsers even machines.
Click “Save” in Result area, it will popup for name and description to save current query.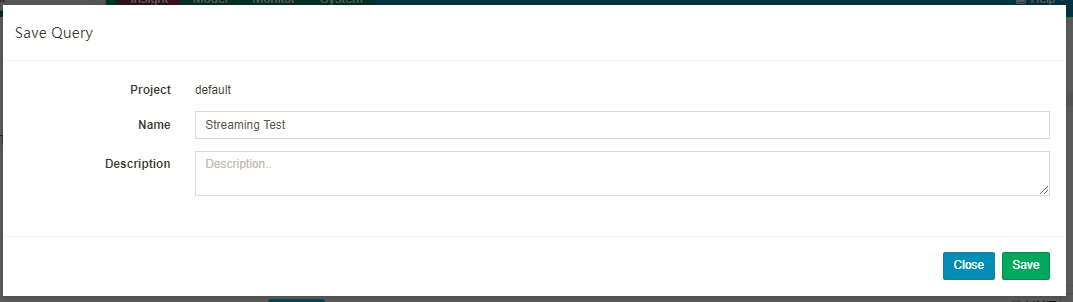
Click “Saved Queries” to browser all your saved queries, you could direct submit it or remove it.
-
Query History:
Only keep the current user’s query history in current bowser, it will require cookie enabled and will lost if you clean up bowser’s cache. Click “Query History” tab, you could directly resubmit any of them to execute again.
5. Pivot Analysis and Visualization
There’s one simple pivot and visualization analysis tool in Kylin’s web for user to explore their query result.
-
General Information:
When the query execute success, it will present a success indicator and also a cube’s name which be hit.
Also it will present how long this query be executed in backend engine (not cover network traffic from Kylin server to browser).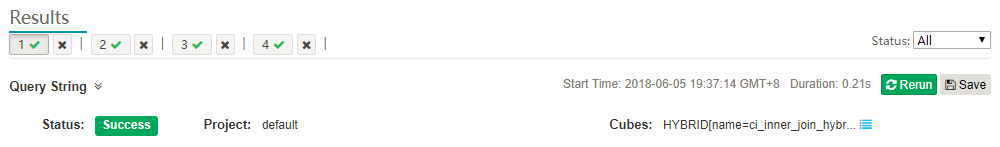
-
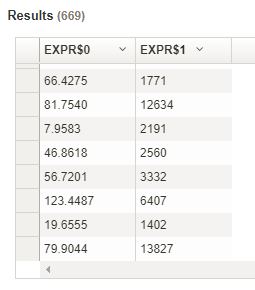
Query Result:
It’s easy to order on one column.
-
Export to CSV File:
Click “Export” button to save current result as CSV file.
-
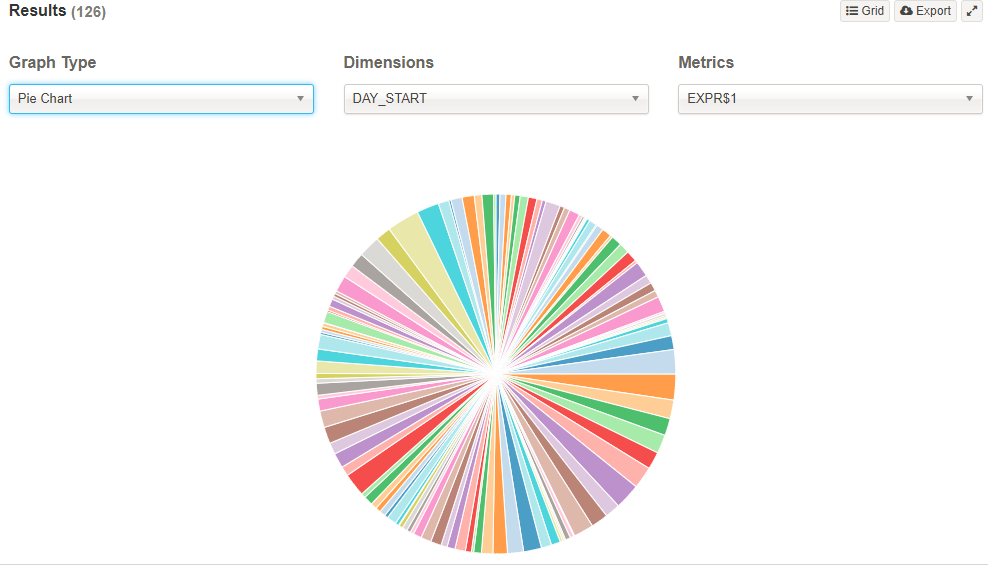
Visualization:
Also, the result set will be easy to show with different charts in “Visualization”. There are 3 types of charts: line chart, pie chart and bar chart.
note: line chart only available when there’s at least one dimension with real “Date” data type of column from Hive Table.
- Pie Chart: