
Use Python for Data Science with Apache Kylin
Original from Kyligence tech blog
In today’s world, Big Data, data science, and machine learning analytics and are not only hot topics, they’re also an essential part of our society. Data is everywhere, and the amount of digital data that exists is growing at a rapid rate. According to Forbes, around 175 Zettabytes of data will be generated annually by 2025.
The economy, healthcare, agriculture, energy, media, education and all other critical human activities rely more and more on the advanced processing and analysis of large quantities of collected data. However, these massive datasets pose a real challenge to data analytics, data mining, machine learning and data science.
Data Scientists and analysts have often expressed frustration while trying to work with Big Data. The good news is that there is a solution: Apache Kylin. Kylin solves this Big Data dilemma by integrating with Python to help analysts & data scientists finally gain unfettered access to their large-scale (terabyte and petabyte) datasets.
Machine Learning Challenges
One of the main challenges machine learning (ML) engineers and data scientists encounter when running computations with Big Data comes from the principle that higher volume or scale equates to greater computational complexity.
Consequently, as datasets scale up, even trivial operations can become costly. Moreover, as data volume rises, algorithm performance becomes increasingly dependent on the architecture used to store and move data. Parallel data structures, data partitioning and placement, and data reuse become more important as the amount of data one is working with grows.
What Apache Kylin Is and How It Helps
Apache Kylin is an open source distributed Big Data analytics engine designed to provide a SQL interface for multi-dimensional analysis (MOLAP) on Hadoop. It allows enterprises to rapidly analyze their massive datasets in a fraction of the time it would take using other approaches or Big Data analytics tools.
With Apache Kylin, data teams are able to dramatically cut down on analytics processing time and associated IT and ops costs. It’s able to do this by pre-computing large datasets into one (or another very small amount) of OLAP cubes and storing them in a columnar database. This allows ML Engineers, data scientists, and analysts to quickly access the data and perform data mining activities to uncover hidden trends easily.
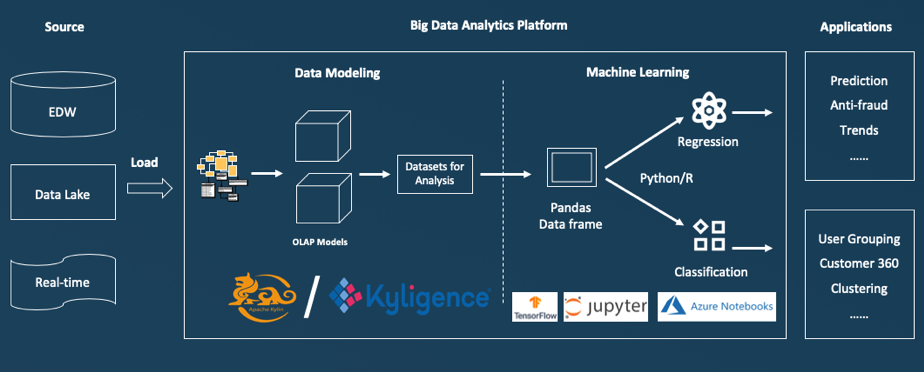
The Following diagram illustrates how machine learning and data science activities on big data become much easier when Apache Kylin is introduced.
How to Integrate Python with Apache Kylin
Python has quickly risen in prominence to take its spot as one of the leading programming languages in the data analytics field (as well as outside the field). With its ease of use and extensive collection of libraries, Python has become well-positioned to take on Big Data.
Python also provides plenty of data mining tools to assist in the handling of data, offering up a variety of applications already adopted by the machine learning and data science communities. Simply put, if you’re working with Big Data, there’s probably a way Python can make your job easier.
Apache Kylin can be easily integrated with Python with support from Kylinpy. Kylinpy is a python library that provides a SQLAlchemy Dialect implementation. Thus, any application that uses SQLAlchemy can now query Kylin OLAP cubes. Additionally, it also allows users to access data via Pandas data frames.
Sample code to access data via Pandas:
$ python
>>> import sqlalchemy as sa
>>> import pandas as pd
>>> kylin_engine = sa.create_engine('kylin://<username>:<password>@<IP>:<PORT>/<project_name>',
connect_args={'is_ssl': True, 'timeout': 60})
>>> sql = 'select * from kylin_sales limit 10'
>>> dataframe = pd.read_sql(sql, kylin_engine)
>>> print(dataframe)
Benefits of using Apache Kylin as Data Source:
● Easy Access to Massive Datasets: Interactively work with large amounts (TB/PB) of data.
● Blazing Fast Performance: Get sub-second response times to your queries on Big Data.
● High Scalability: With Kylin’s linear scalability, scale up your data without worrying about performance.
● Web Scale Concurrency: Deploy to thousands of concurrent users.
● Minimal Data Engineering: Invest time in discovering insights and leave the data engineering to Apache Kylin.
A Use Case: Data Science with Apache Kylin
Dataset
We imported an IMDB movie dataset (Source: Movielens) into our Kylin OLAP cube and used Python to read the data and perform exploratory analysis in order to find trends in movie ratings for different genres over a given period of time.
Motivation
▪ Identify top rated movies.
▪ Compare Male vs Female preference for different movie genres.
▪ Find correlation between Occupation & Genre.
▪ Analyzing trends in average movie ratings for different genres across the weeks.
▪ Compare Men & Women average ratings.
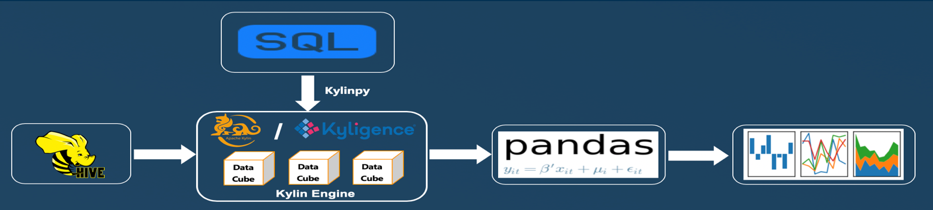
Data Lifecycle
In order to analyze the data via Python, the Kylinpy library was used and SQL(s) were written to ingest relevant data for the analysis in question. The dataset(s) returned via SQL(s) were stored as Pandas data frame(s) and then data manipulation was done on the data frames to bring the data into a shape suitable for our analysis. We have leveraged the Matplotlib and Seaborn libraries for visualizing the data. The diagram below illustrates the data lifecycle through each of its stages.
Analysis
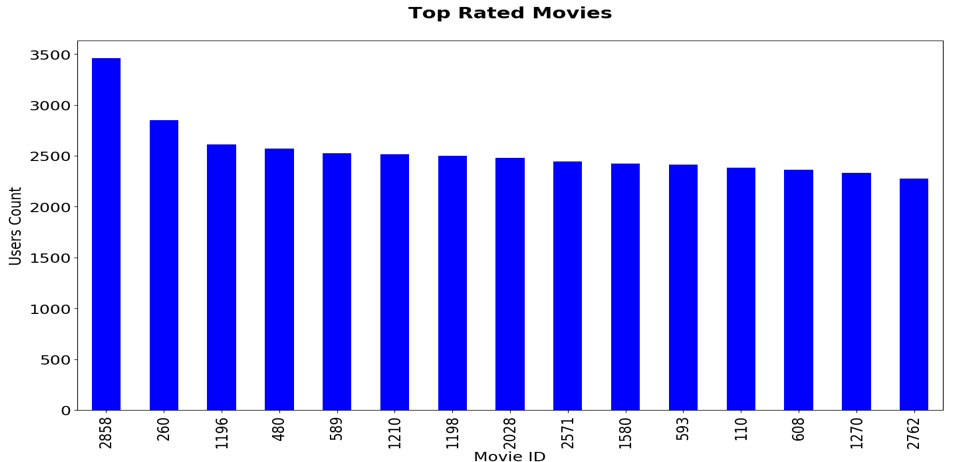
Let us first visualize the top-rated movies. It can be seen that from the top 15 movies, apart from top 2, 13 movies have been rated by an almost equal number of viewers. This information is a starting point for correlational discovery and can be further drilled down into to find the correlation between the closely rated movies.
import sqlalchemy as sa
import pandas as pd
import matplotlib.pyplot as plt


kylin_engine = sa.create_engine('kylin://<username>:<password>@1<IP>:<PORT>/<project_name>', connect_args={'timeout': 60})
sql = 'select movieid,count(distinct userid) as COUNT_USERS from userratings group by movieid order by count(distinct userid) desc limit 15'

moviecount = pd.read_sql(sql, kylin_engine)

df=moviecount.sort_values(by='COUNT_USERS', ascending=False, na_position='first')

ax = df.plot(kind='bar', x='MOVIEID', y='COUNT_USERS',figsize=(15,10),legend=False, color='blue', fontsize=18)
ax.set_xlabel("Movie ID",fontsize=18)
ax.set_ylabel("Users Count",fontsize=18)
plt.title('Top Rated Movies',fontweight="bold",fontsize=22,y=1.05)

plt.show()
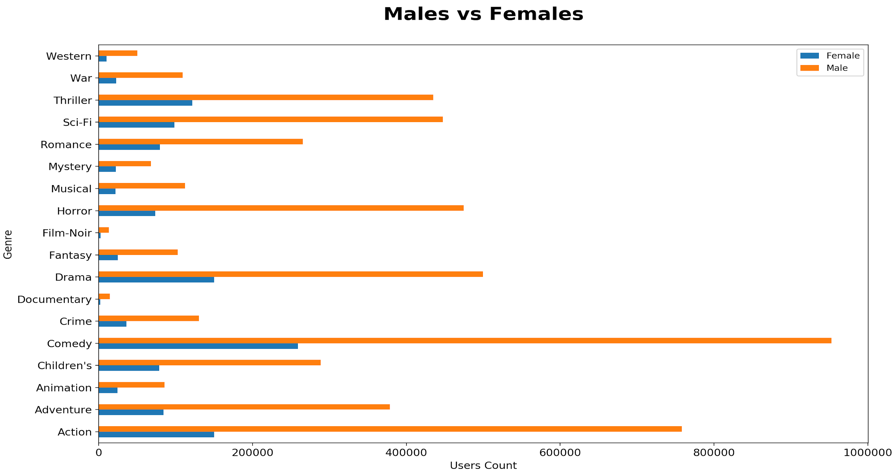
Similarly, plot below displays the comparison of Males vs. Females count per Genre. This describes a gender-based inclination across various movie genres.
import sqlalchemy as sa
import pandas as pd
import numpy as np
import matplotlib.pyplot as plt


kylin_engine = sa.create_engine('kylin://<username>:<password>@1<IP>:<PORT>/<project_name>', connect_args={'timeout': 60})
sql = 'SELECT movies.genre as genre,users.gender as gender, count(userrat.userid) as counts from jainnik.userratings as userrat \
 inner join jainnik.movies as movies on movies.movieid =  userrat.movieid \
inner join jainnik.viewer as users on userrat.userid = users.userid \
group by genre,gender'

df2 = pd.read_sql(sql, kylin_engine)

df2.columns = ['GENRE', 'GENDER', 'COUNTS']

df3= df2[df2['GENDER'] == 'M']

df3.columns = ['GENRE', 'GENDER_M', 'COUNT_M']

df4= df2[df2['GENDER'] == 'F']

df4.columns = ['GENRE', 'GENDER_F', 'COUNT_F']

df_con = df4.merge(df3, left_on='GENRE', right_on='GENRE', how='inner')

df_con.columns = ['GENRE', 'GENDER_F', 'Female', 'GENDER_M', 'Male']

df_con = df_con.reindex(columns=['GENRE', 'GENDER_F', 'Female', 'GENDER_M', 'Male'])

df_con1 = df_con[:10]

ax = df_con1.plot(kind='barh', x='GENRE',figsize=(15,10),legend=True, fontsize=12)
ax.set_ylabel("Genre",fontsize=12)
ax.set_xlabel("Users Count",fontsize=12)
plt.title('Males vs Females',fontweight="bold",fontsize=22,y=1.05)

plt.show()
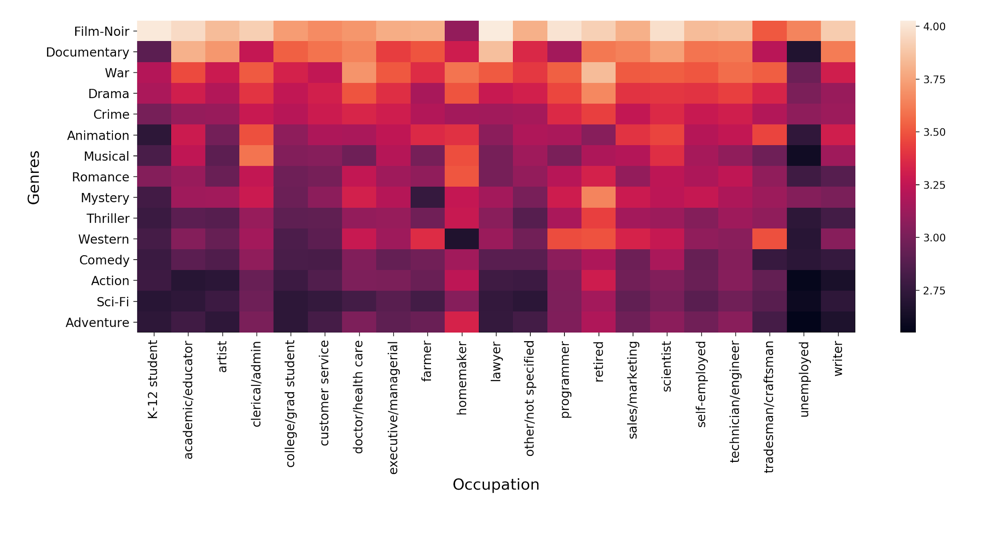
From the below correlation matrix (Heat map), we can state the relationship between Occupation and Genres of Movies that an individual prefers. For example: Farmers do not prefer to watch Mystery based movies and College Students prefer Film-Noir or Documentaries.
import sqlalchemy as sa
import pandas as pd
import matplotlib.pyplot as plt
import numpy as np
import calendar
import seaborn as sns

kylin_engine = sa.create_engine('kylin://<username>:<password>@1<IP>:<PORT>/<project_name>', connect_args={'timeout': 60})

sql1 = 'select genre,occupation,AVG(cast(rating as decimal(1,6))) as RATING from USERRATINGS \
inner join movies on USERRATINGS.movieid = movies.movieid \
inner join viewer on viewer.userid = userratings.userid inner join occupation on viewer.occupationid=occupation.occupationid \
group by genre, occupation'

df1 = pd.read_sql(sql1, kylin_engine)

df10 = df1.pivot_table(values='RATING', index=['GENRE'],columns='OCCUPATION')
#print(df10.head(100))
df10=df10.sort_values("college/grad student",ascending=False)

ax = sns.heatmap(df10.head(15),cmap="BuPu")
plt.xticks(fontsize=12)
plt.yticks(fontsize=12)
plt.xlabel("Occupation",fontsize=15)
plt.ylabel("Genres",fontsize=15)

for x in ax.get_xticklabels():
    x.set_rotation(90)
for x in ax.get_yticklabels():
    x.set_rotation(0)
plt.tight_layout()
plt.show()
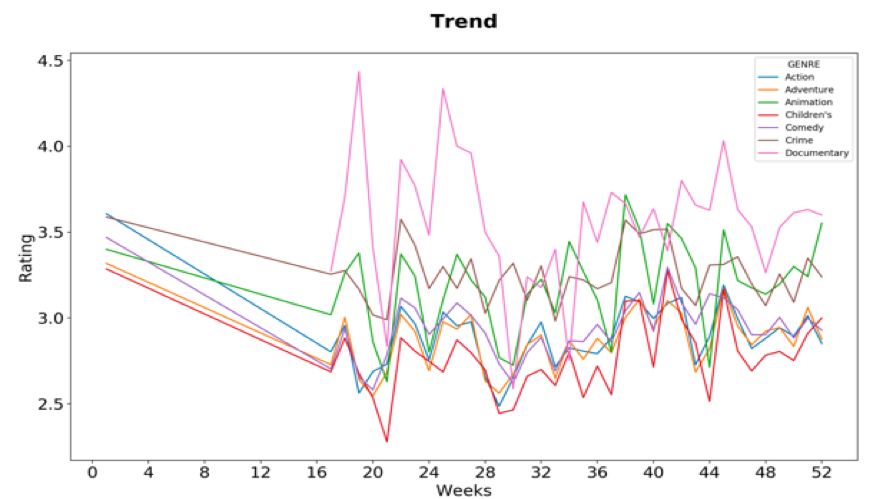
The next figure shows the trends of the average ratings by users for different genres across different weeks for a given year. From the chart it can be seen that Documentary and Crime movies are amongst people’s favorites while children’s movies always had the lowest average rating.
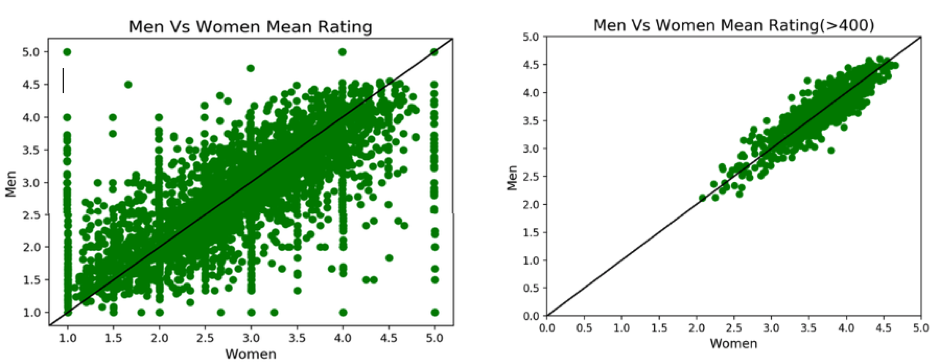
The two scatter plots below are used for a side by side comparison to infer correlation between the ratings of Men and Women.
Left Plot: The scatter plot shows that the average rating of Men and Women (all movies) has a linearly increasing trend and the highly concentrated part of the plot is equally distributed on both sides of the reference line, which depicts that apart from a few movie ratings, Men and Women tend to think alike.
Right Plot: The scatter plot was produced by segregating only those movies which have been rated more than 400 times. In this case as well we can see that Men and Women have similar ratings, suggesting that our initial inference was accurate.
Get Started with Python on Apache Kylin
We discussed how Python easily integrates with Apache Kylin’s OLAP technology using the Kylinpy library, which in turn was used to run advanced analytics on our example movie dataset. We also used Pandas, Matplotlib and Seaborn libraries to manipulate and visualize the data residing in our Apache Kylin cubes.
Such analysis gave us insight into how people’s liking of different movie genres changes over time. It also told us about the strength of association between trends in different movie genres. Insights like these could be useful for movie critics.
If you or your team are facing issues in fully accessing your massive datasets and want to leverage Kylin’s OLAP on Big Data approach for your machine learning or data science activities, Apache Kylin has you covered. Visit the download page to try Apache Kylin now. For more information about Apache Kylin’s OLAP analytics solutions visit Apache Kylin website.